前面,差异分析得到了4913个基因,注释后剩下4863个基因,如下:
1 | > dim(result_select) |
现在,我们对这4863个已知基因进行富集分析,看这些基因都集中在哪些信号通路或者生物过程当中。
1 | library(clusterProfiler) |
现在,准备工作完成了,开始绘图
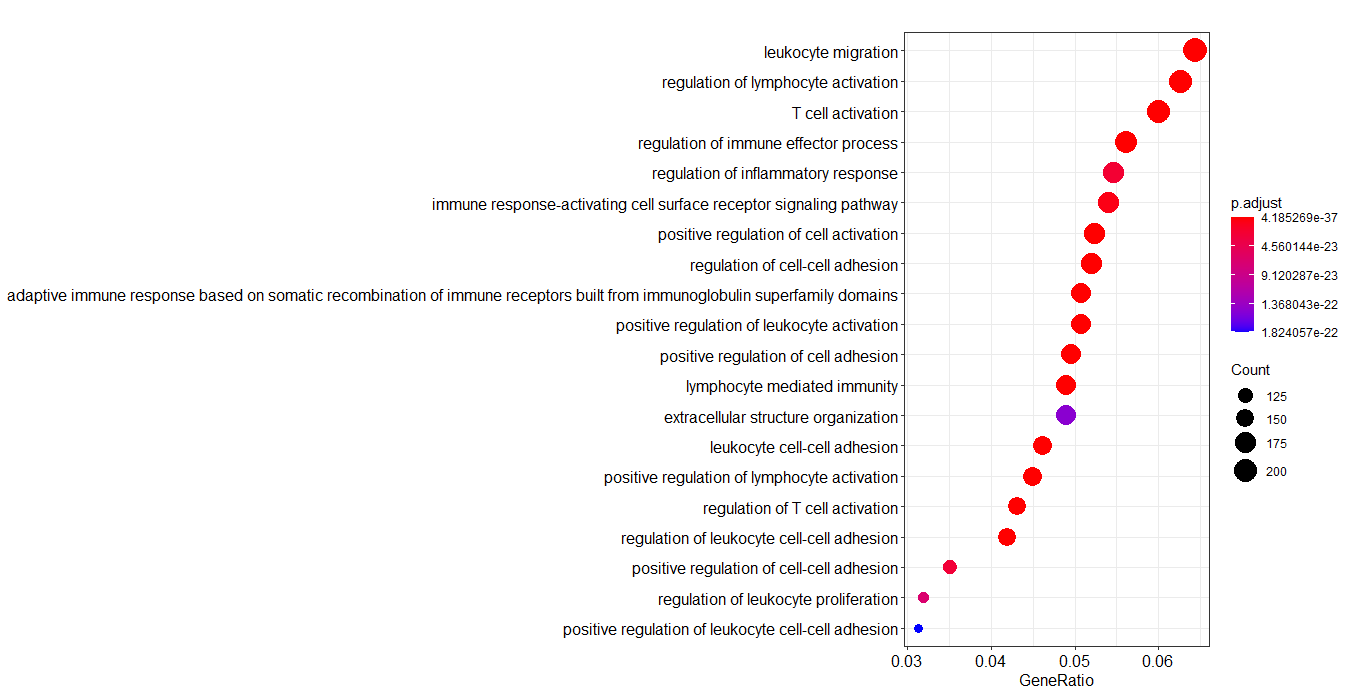
1 | dotplot(enrich_go_BP,showCategory=20) |

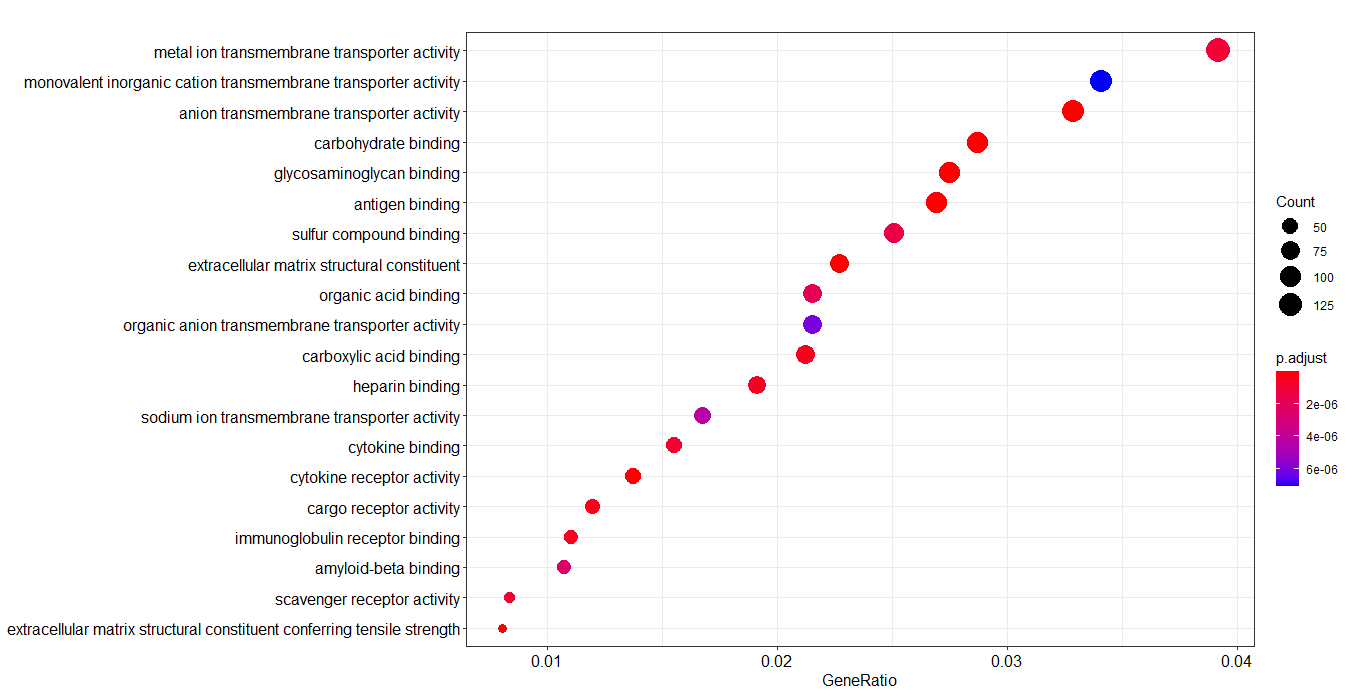
1 | dotplot(enrich_go_MF,showCategory=20) |

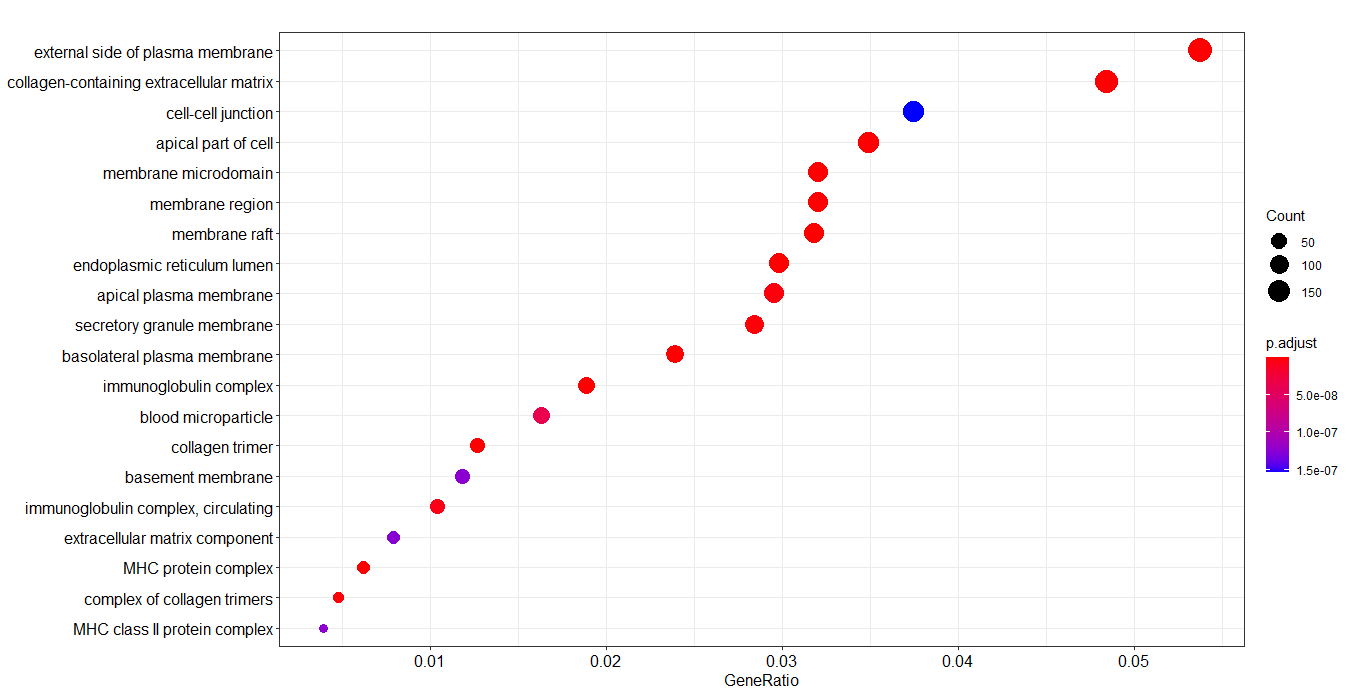
1 | dotplot(enrich_go_CC,showCategory=20) |

由于肾脏是排泄器官,可以看到绝大多数基因都集中在细胞外或细胞膜,而功能方面多参与膜运输,而参与的生物学过程多与免疫相关。
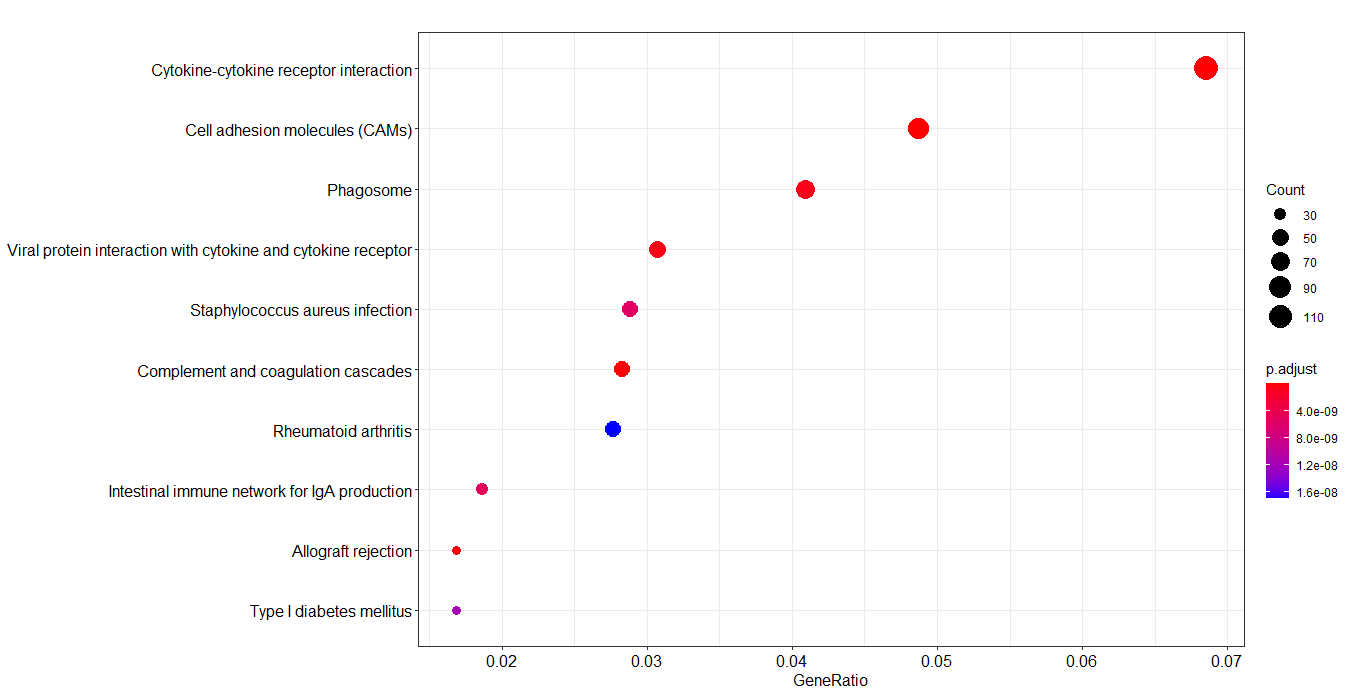
1 | dotplot(enrich_go_KEGG) |

