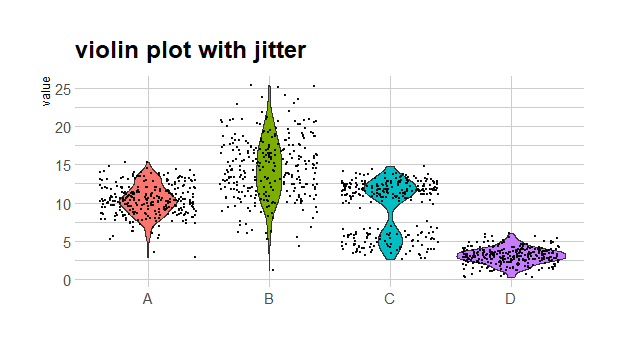
一、简单小提琴图
小提琴图的作图数据同箱线图,X轴为定性变量,Y轴为定量变量,数据量足够大才有统计意义;
1 | library(ggplot2) |
二、小提琴图优化
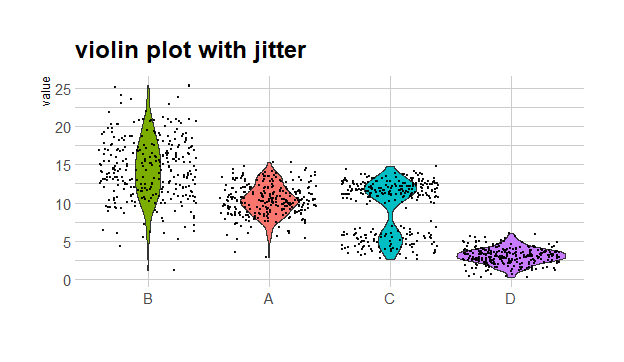
2.1 排序
1 | # 如果要对X轴进行升序排列,使用reorder(x=x,y=y)函数; |
2.2 调节Y轴限度,使用ylim()函数
1 | ggsave(pviolin,filename="violin4.png",width=12,height=9) |
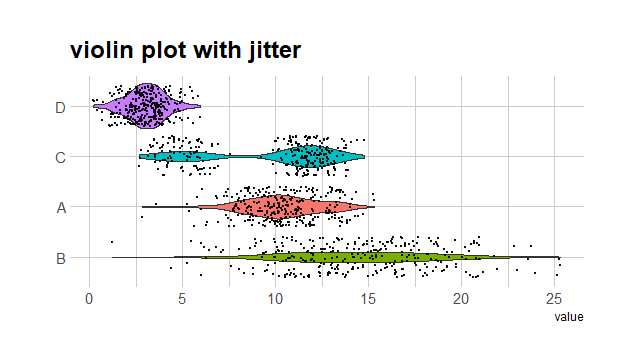
2.3 绘制水平小提琴图,加上coord_flip()函数
1 | pviolin <- ggplot(data,aes(x=reorder(name,-value),y=value,fill=name))+ |
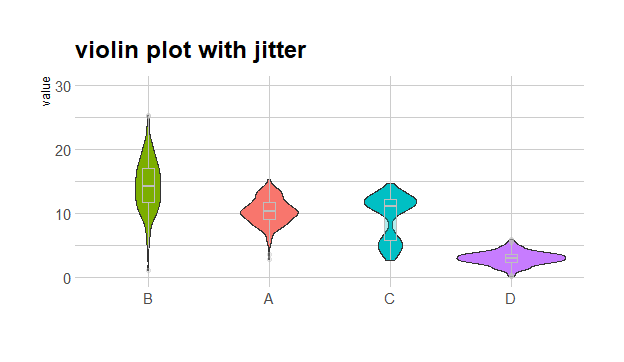
2.4 同时绘制小提琴图与箱线图
1 | pviolin <- ggplot(data,aes(x=reorder(name,-value),y=value,fill=name))+ |