R语言学习笔记10-基础绘图函数plot

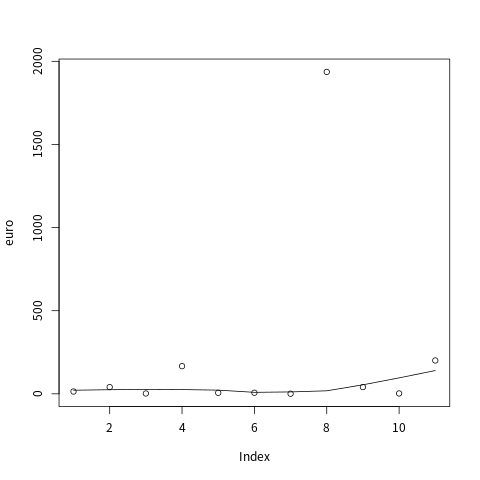
R中有个默认的数据叫euro(欧元汇率,长度为11),以euro为例来看一下如何使用绘图函数plot。

plot基本语法:plot(x,y,xlab,ylab,main=,sub)

1
2
plot(euro) # 作图
lines(lowess(euro)) # 添加一条平滑曲线

type用于指定图形的类型:

1
2
3
4
5
6
7
8
9
10
> par(mfrow=c(3,3)) # 使用par函数,参数mfrow指定图形排布3X3
> plot(euro,type="p") # 同plot(euro),"p" for points
> plot(euro,type="l") # "l" for lines
> plot(euro,type="b") # "b" for both
> plot(euro,type="c") # "c" for the lines part alone of "b"
> plot(euro,type="o") # "o" for both ‘overplotted’
> plot(euro,type="h") # "h" for ‘histogram’
> plot(euro,type="s") # "s" for stair steps
> plot(euro,type="S") # "S" for other steps
> plot(euro,type="n") # "n" for no plotting

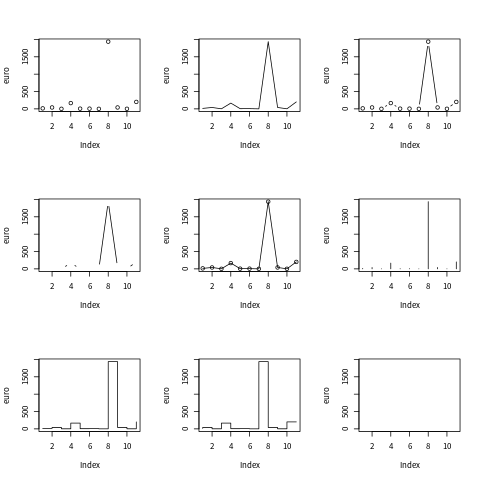
pch,用于指定图形样式,共25种,默认为1,如果pch=x,则每个点的样式都不同;
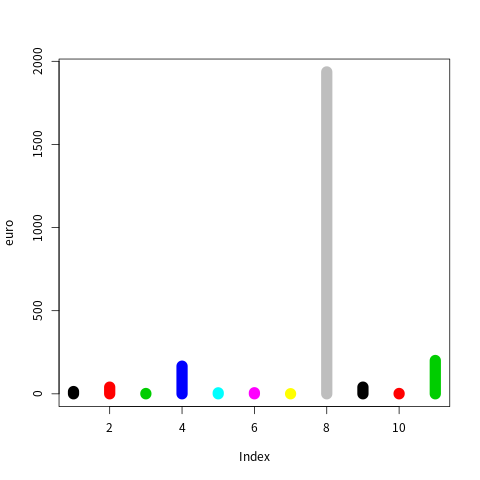
col,用于指定颜色,共657种,可以使用colors()查看;
lwd,用于指定宽度

1
lot(euro,pch=1:11,col=1:11,type="h",lwd=15)

  • 本文作者:括囊无誉
  • 本文链接: R/R_visualize_basicplot/
  • 版权声明: 本博客所有文章均为原创作品,转载请注明出处!
------ 本文结束 ------
坚持原创文章分享,您的支持将鼓励我继续创作!